
The short answer
Start with the question and the publishing account. Use post analytics for one post, combined analytics for portfolio activity over dates, audience analytics for followers, and profile analytics for profile discovery. Record the metric, dates and aggregation before interpreting a number. Similar-looking totals can describe different sets of events.
What you’ll take away
- A date filter does not necessarily change the observation period of every number on screen.
- Content viewers, followers and profile visitors are different audiences.
- Keep missing, unavailable and observed zero values separate.
Choose a surface that answers your question
LinkedIn’s member overview separates individual posts, combined content, followers and profile discovery. Those views are not interchangeable. Confirm whether you are looking at your personal member profile or a Page; a Page-admin report can have different definitions and permissions.
Use this original question map before collecting numbers. For a fictional author preparing an explanation about date filters, the first task is to find out whether the explanation was displayed. Later questions about followers or customer enquiries require additional evidence. A large number on the profile card cannot answer all three.
| Question | Start here | Do not substitute |
|---|---|---|
| What happened around one post? | That post’s analytics | All-profile totals |
| What activity did my content receive during a period? | Combined content analytics | A sum of selected lifetime post counts |
| How did the following change? | Audience analytics | A single follower snapshot |
| Was my profile discovered? | Profile visitors / search appearances | Content impressions |
| Did a customer buy? | Your verified business records | A reaction or profile visit |
Read the metric, clock and aggregation together
Open Analytics & tools and its combined post analytics. The current help describes a date selector, an impressions/engagements choice and daily/cumulative presentation. Choose the question before changing these controls, and preserve the labels with your observation. A cumulative line is not a sequence of independent daily counts to add again.
The combined help says its performance graph is complete through yesterday. Treat an absent current-day point accordingly rather than recording zero. The date range, observation time and any incomplete day belong in the same note as the value. Do not infer a real-time update guarantee from a changing display.
A post table can use the date selector differently
LinkedIn’s current help describes a desktop Most recent posts performance table that is still rolling out. Its date selector chooses posts created in the period, but each row’s metrics are lifetime totals. Those totals do not become period-only counts when the creation-date filter changes. A dash can mean that a metric is unavailable for that post type.
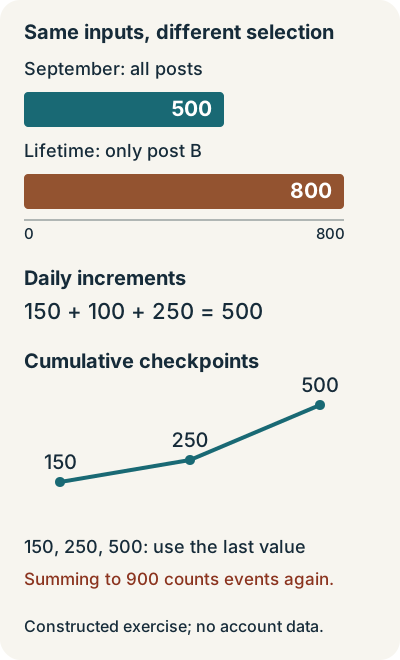
Consider a deliberately constructed September example. Content receives 500 impressions during September: 400 on older post A and 100 on September post B. When checked later, B has 800 lifetime impressions. A table restricted to posts created in September can show B’s 800 while the September activity graph shows 500. The different selections and clocks explain why adding one view need not reproduce the other; this is not a measured account incident.
The downloadable exercise makes that reconciliation inspectable. Its five dated count rows produce 500 September impressions across A and B, while B totals 800 at the stated 3 October observation. Filtering posts by September creation selects B; filtering events by September selects rows for both posts. Record those two choices separately before deciding that the views disagree.
In the same exercise, daily increments of 150, 100 and 250 produce cumulative checkpoints of 150, 250 and 500. Adding those checkpoints would give 900 and count some events again. The checker verifies the actual rows and keeps observed zero, unavailable and not collected separate. These constructed inputs do not validate a LinkedIn export or a private account. Use the blank record to inspect your own source labels while keeping private data local.
| Constructed view | What is selected | Count |
|---|---|---|
| September activity | Displays received during September across the portfolio | 500 |
| B during September | The portion of those displays belonging to B | 100 |
| B lifetime at a later observation | All displays accumulated by B by that observation | 800 |
Separate audiences and event definitions
An impression is a display; distinct reach is a different unit. Followers describe an ongoing audience relationship, while profile visits concern the profile surface. A person may appear in several of these groups, so adding their totals does not count distinct people. A private post breakdown also does not identify every person who silently read it.
Read an engagement label literally. A public reactions-plus-comments calculation is narrower than a combined total that includes other event types. Keep the numerator definition beside the result. If a tool uses a different definition or observation scope, name that difference before comparing its percentage.
Translate the main fields into a checkable meaning
Keep a small glossary with your report. A unit tells you what the number counts, while the source and date tell you which observations belong in it. The table covers the main member-level families; availability and membership-dependent profile details must still be checked in your account.
For a constructed follower example, a change from 100 to 120 is a net increase of 20, not proof of exactly 20 new followers: 40 gains and 20 losses would produce the same endpoints. LinkedIn’s audience help says its date selection affects new-follower trends and demographics, not the total-follower counter. Demographics show up to five results within each category, such as industry or job title. They summarize followers, not an identity list or everyone who saw a post.
| Field | Meaning to preserve | Useful check |
|---|---|---|
| Impressions / members reached | Displays / estimated distinct reached accounts | Never call every display a different reader |
| In-network / out-of-network | Exposure breakdown by follow/connection relationship | Check the denominator; a share of displays is not a share of all followers |
| Reactions, comments, reposts, saves, sends | Different interaction-event types | State which events your total includes |
| Visits to external links | Click events under the displayed link metric | Repeated clicks and subsequent enquiries are separate |
| Total / new followers | Snapshot count / gains over the selected period | Keep total stock distinct from a flow and net change |
| Profile views / search appearances | Profile visits / profile discovery through search | Neither is post reach or a list of all content readers |
| Follower demographics | A limited category breakdown of followers | Top categories are not a complete population census |
Finish with a decision note, not a verdict about the algorithm
For the fictional date-filter explanation, save the post reference, exact metric and observation age. Then record whether the intended question was answered: did relevant replies correctly distinguish period activity from lifetime totals? Review the content and conversation as well as the distribution count. Exposure alone does not establish understanding.
Write a bounded conclusion such as: “The two totals use different scopes; I will label the lifetime column in the next report.” Keep the original observation and the change to check later. A small before/after series cannot isolate the effect of that label from topic, audience and distribution changes.
This is a source-checked reading workflow, not an account connection or a completed examination of your private dashboard. Use the actual available controls if the rollout differs. Wrapped.li’s public-activity recap can prompt reflection but does not supply private impressions or replace the owner’s native analytics.
Sources & product references
Product details reflect the publication date. External features and interfaces may change.
- LinkedIn: Analytics for members
- LinkedIn: Combined post analytics
- LinkedIn: Post analytics definitions
- LinkedIn: Audience fields and their date-filter scope
- LinkedIn: Profile search appearances
- LinkedIn: Zusammengefasste Beitragsanalysen, Deutsch
- LinkedIn: Analysedaten zu Zielgruppen, Deutsch
- LinkedIn: Beitragsanalysen für Ihre Inhalte, Deutsch


