The short answer
Choose the population question and statistical unit before resampling. Repeated posts from one creator are not automatically independent creator observations. A row bootstrap and a whole-group bootstrap preserve different dependence structures; neither repairs selective data or an unsuitable design. Keep the chosen statistic, grouping and full resampling distribution, and do not promise reliable inference from only a few groups.
What you’ll take away
- More rows do not necessarily mean more independent units.
- Resample complete groups when that matches the dependence and target question.
- An exact toy resampling distribution is not a validated population interval.
Choose the target average and the independent unit
A report about the average measured post can weight a prolific creator more than a report about the average creator’s own mean. Write that target explicitly. Then identify dependence: posts may share an author, campaign or time period. A file’s row ID is not evidence of statistical independence, and clustering by a new name alone does not establish the right design.
For a whole-group bootstrap, groups are sampled with replacement and their member rows stay together. Stata’s primary documentation describes this cluster option and notes that unequal group sizes can change the number of rows in a draw. Our teaching exercise uses four equally sized groups so that the target mean is the same under the two displayed schemes.
Inspect all forty constructed rows as four groups
Groups G1 and G2 each contain ten zeros; G3 and G4 each contain ten ones. These are invented binary exercise values, not real creator or reader outcomes. The observed mean is 20/40=0.5. There are 40 rows but only four groups; every row within a group is identical by construction.
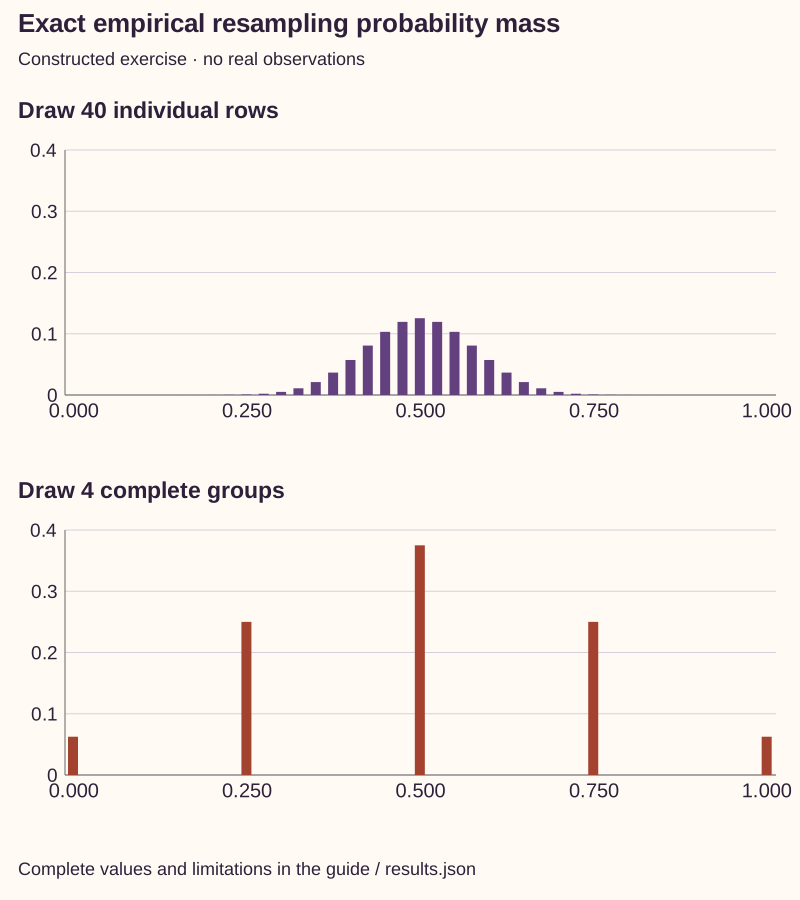
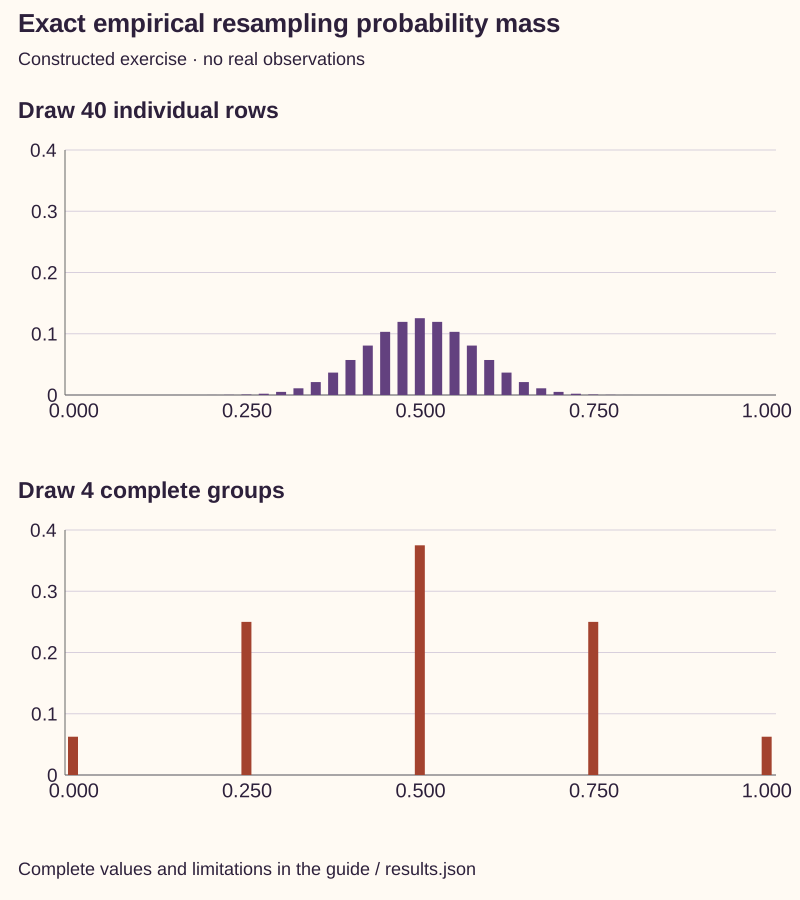
Scheme A draws 40 individual rows with replacement. Each draw sees the pooled half-zero, half-one distribution and breaks the grouping. Scheme B draws four entire groups with replacement, retaining ten identical rows per selected group. It preserves this constructed within-group structure under an assumption of independently sampled groups; the fixture does not establish that assumption for real data.
Reproduce the exact empirical resampling distributions
In this special equal-size binary fixture, Scheme A’s mean is K/40 with K distributed Binomial(40,0.5); Scheme B’s mean is K/4 with K distributed Binomial(4,0.5). The checker calculates every probability mass using integer combinations. It separately enumerates all 4⁴=256 ordered group draws and checks agreement. No random seed or simulated participant is needed.
The exact empirical standard deviations are sqrt(0.25/40)≈0.07906 and sqrt(0.25/4)=0.25. The inverse-CDF 2.5% and 97.5% quantile limits are [0.35,0.65] and [0,1]. These are properties of two resampling distributions conditional on the supplied fixture, not certified 95% population confidence intervals. The probability-mass figures retain the sparse group distribution rather than smooth it into a reassuring bell.
| Empirical scheme | Mean | SD of resampled means | 2.5% / 97.5% quantiles |
|---|---|---|---|
| 40 individual rows | 0.5 | 0.07906 | 0.35 / 0.65 |
| 4 complete groups | 0.5 | 0.25 | 0 / 1 |
Keep small-group uncertainty and unequal weighting visible
Cameron and Miller discuss why cluster resampling with few clusters can still give unreliable inference and why the entire bootstrap distribution needs inspection. Our four-group illustration deliberately exposes that limitation; it is not a recommended real study size or a demonstration that the wider displayed limits have correct coverage.
A second constructed check has two zero-valued posts from creator A and eight one-valued posts from creator B. The post-weighted mean is 0.8; the equal-creator mean is (0+1)/2=0.5. With unequal sizes, preserve the intended statistic inside every group draw. Silently averaging group means changes a post-weighted question into a creator-weighted one.
Resolve three resampling decisions
R1 — Forty highly dependent rows are advertised as forty independent creators. Decision: retain the four groups and compare both declared schemes on all original rows. Result: a dependency-sensitive exercise, not forty observed people or proof of population precision.
R2 — Group sizes differ and the report switches between 0.8 and 0.5 without a target label. Decision: state post-weighted versus equal-creator means and preserve the corresponding calculation in each resample. Result: different explicit estimands rather than an unexplained software discrepancy.
R3 — A bootstrap run omits invalid draws or shows only favorable replicates. Decision: retain the complete intended draw count, invalid-result reasons and distribution, and hold inference if the procedure is unsuitable. Result: no apparently stable interval manufactured by deleting the cases that expose its failure.
Save the unit, statistic and complete conditional result
The worksheet records source/selection, target population and statistic, group definition, group sizes, dependence assumptions, resampling rule and all valid/invalid results. The packet supplies forty fictional rows, exact masses, the unequal-size check and a standard-library reproduction script. It does not train a model, access an account or collect participant data.
The relevant Stata documentation and the primary cluster-inference paper were read on 1 November 2026. This is our bounded numerical explanation, not their empirical dataset or a new study. Selection bias, measurement error, shared cross-group shocks and future distribution changes remain separate problems. Neither resampling nor many repeats establish actual reader preference, customer value or a causal content effect.
Sources & product references
Product details reflect the publication date. External features and interfaces may change.