
The short answer
Name the reader’s comparison and inspect whether the values describe categories, a time-point stock, interval events or a genuine whole. Choose a simple chart that preserves that relationship, then check its scale, labels and complete text/data alternative. A chart cannot supply a missing denominator or turn display events into people.
What you’ll take away
- Choose the data relationship before the visual style.
- Preserve stock versus flow and missing-value states.
- Use the full numbers and explanation beside the graphic.
Write the exact comparison before drawing
Decide what a reader should recover: which category is larger, how a stock changed at observed dates or how a declared total is divided. A decorative ranking shape can make unrelated quantities look comparable. Check source, unit, period and subset before choosing bars, lines or parts of a whole.
The ONS guidance starts with the data relationship and recommends simple familiar charts where possible. Its stock/flow distinction is useful for creator reports: current followers and followers gained during a month answer different questions. Choosing an image upload shape does not settle this semantic choice.
Use a common baseline for the category comparison
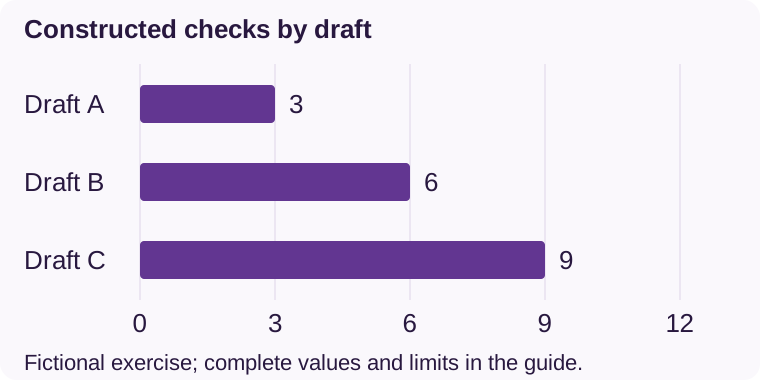
Constructed case C1 compares three independent draft-review counts: A has 3, B has 6 and C has 9 recorded checks. The task is magnitude comparison, so the original bar example uses a shared zero baseline and labels every value. It does not call these checks unique readers, quality scores or a partition of all work.
The downloadable data and graphic agree on the three values. A text alternative says C has nine, B six and A three recorded checks in this fictional example. If the chart is cropped for a post, preserve the axis, unit and constructed label; do not remove the context to create an impressive-looking lead.
| Case | Observation | Value/unit |
|---|---|---|
| C1 | Draft A | 3 Checks |
| C1 | Draft B | 6 Checks |
| C1 | Draft C | 9 Checks |
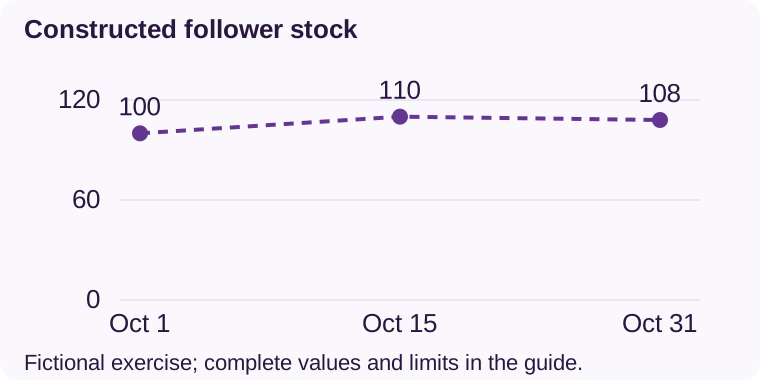
| C2 | October 1, 2026 | 100 follower stock |
| C2 | October 15, 2026 | 110 follower stock |
| C2 | October 31, 2026 | 108 follower stock |
Preserve observed dates and time-point stock
Constructed C2 records follower stock 100, 110 and 108 at three declared observations. The point/line example shows the ordered values with dates. Connecting points is a visual guide between those observations, not measured continuous activity. The endpoint difference is eight; adding the stocks to 318 does not measure followers gained.
Keep the axis interval and labels explicit. If the source instead contains monthly new-follower events, choose the appropriate interval representation and preserve its definition. Missing periods stay missing rather than being silently inserted as zero or interpolated as known observations.
Resolve three complete chart decisions
C1 — Constructed category counts 3, 6, 9: choose labeled common-baseline bars and retain the independent-category unit. Reject a “share of every reader” pie because no such reader population exists. Result: exact comparison in chart, table and text, without an audience claim.
C2 — Constructed stocks 100, 110, 108: choose dated points with a clearly explained connecting line, preserving the three observations. Reject a summed “318 acquired” headline. Result: an observed-endpoint difference of eight in the fixture, not verified acquisition or a continuous growth path.
C3 — Constructed incompatible units: 30 public response events and 1,000 impression events are available, distinct readers are not. Decision: explain 30/1,000 = 3% as the declared event ratio if appropriate, and leave a people-conversion chart out. Result: missing people remain unknown; a visual cannot recover them.
Inspect the graphic and its complete alternative together
W3C’s complex-image guidance calls for the information in a complex graphic to be available in text as appropriate. Keep the necessary values, relationships, title and limits together. A short alternative can point to the actual nearby table; it should not point to a table that was never published.
Inspect the exported graphic at narrow display size and without depending on color. Our originals use labels and simple marks, with all values in this guide and the downloadable data. This is a constructed teaching example, not a screen-reader study or proof that one chart improves engagement.
Keep a reproducible chart-selection record
The private worksheet records reader question, source/unit, category/time/whole relationship, missing values, rejected chart and exact export/text checks. The packet includes the complete constructed dataset, original SVGs in both languages and a dependency-free reproduction script; repeated languages are not new scenarios.
Sources were read on 1 November 2026. Reproduction checks arithmetic and exact generated assets only. No real LinkedIn account, follower dataset, population benchmark, reader task or business outcome was measured.
Sources & product references
Product details reflect the publication date. External features and interfaces may change.


