The short answer
Keep the exact question, ordered category labels and count in every category. Report skipped and not-applicable states separately. Order alone does not supply equal distances between categories: a mean of numeric codes describes the chosen scoring rule, not automatically a measured amount of ease. A full distribution and the middle ordered category or pair can preserve what the answers actually say.
What you’ll take away
- A code number can record order without measuring a distance.
- Keep the scale-answer denominator beside any top-category percentage.
- A changed coding rule can change the mean without changing one answer.
Choose an ordered item rather than assume a measuring ruler
The narrower job here is interpreting a completed ordered item, not designing a survey or coding open text. Preserve the actual wording, reference task, language, category order and direction. “Very difficult” through “Very easy” has an order; it does not by itself measure how many times easier one category is than another.
CDC distinguishes rankable categories from measurements with equally spaced units. We use that distinction in an original creator-feedback exercise. Numeric scoring can be useful under an explicitly justified measurement model, but an input code of 4 does not establish twice the ease represented by 2. A composite validated instrument needs its own scoring instructions, not this generic recoding exercise.
Retain the complete constructed distribution
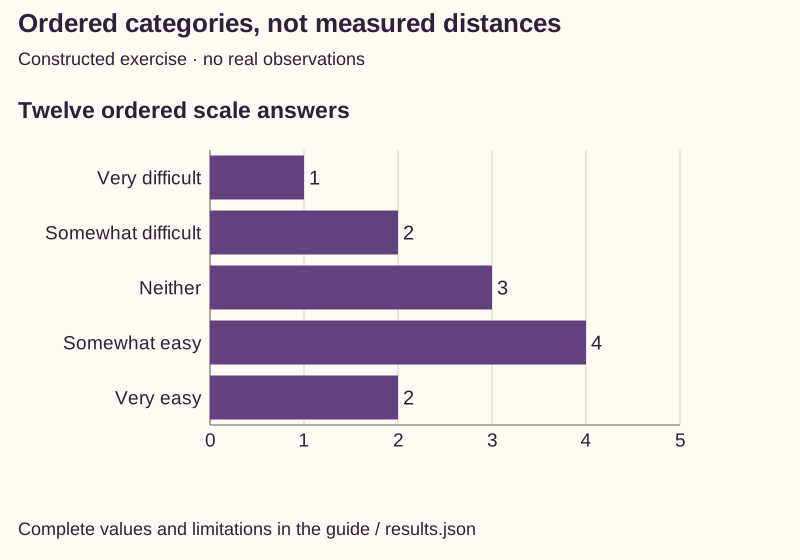
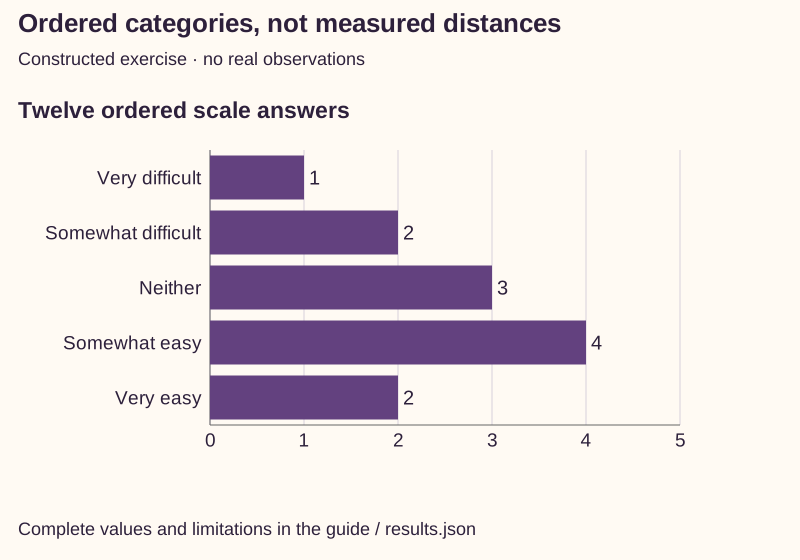
The original fixture supplies 14 fictional records: 12 scale answers, one Not applicable and one skipped. Counts in the five ordered categories are 1, 2, 3, 4 and 2. Those are exercise inputs, not people who answered this blog’s study. Keep both non-scale states outside the ordered scale rather than assign them the lowest category.
Six of the 12 scale answers are Somewhat easy or Very easy: 50% of scale answers. Six out of all 14 supplied records is about 42.86%, a different explicitly labeled denominator. Neither proportion can be advertised as audience preference, task completion, a representative estimate or a comparison with another guide.
| Ordered category or separate state | Constructed records |
|---|---|
| Very difficult | 1 |
| Somewhat difficult | 2 |
| Neither | 3 |
| Somewhat easy | 4 |
| Very easy | 2 |
| Not applicable — outside scale | 1 |
| Skipped — outside scale | 1 |
Inspect the middle positions without averaging words
With 12 scale answers the central ordered positions are 6 and 7. Position 6 is Neither; position 7 is Somewhat easy. Report that central pair, or declare a particular lower/upper median convention. Do not invent a verbal category halfway between them merely because a spreadsheet averages numeric codes for an even sample.
The mode is Somewhat easy with four answers, while the central pair spans two labels. These summaries answer different questions. Keep the full five-category distribution alongside them so that neither a top-two percentage nor a single “typical answer” erases the difficult responses.
Reproduce two codings of the same unchanged answers
Coding the categories 0, 1, 2, 3, 4 gives a mean score of 28/12≈2.333. The strictly increasing coding 0, 1, 2, 10, 11 preserves every category and its order but gives 70/12≈5.833. Counts, the modal category and the central pair have not changed. The mean is sensitive to the declared distances.
This does not mean arithmetic software malfunctioned or that every numerical model for ordered responses is forbidden. It means the distances need a substantive justification if the score is interpreted as an amount. Preserve the coding and category distribution when using such a model; do not select the coding that produces the most flattering average.
| Coding | Codes in category order | Mean code |
|---|---|---|
| Consecutive | 0 / 1 / 2 / 3 / 4 | 2.333 |
| Unequal gaps | 0 / 1 / 2 / 10 / 11 | 5.833 |
Resolve three scoring and reporting decisions
O1 — A summary calls the 50% top-two result “half of all readers prefer us.” Decision: restrict it to six of twelve fictional scale answers about the stated ease item, with the full counts. Result: neither a real preference measure nor a population claim.
O2 — An even-sample median is exported as numeric 2.5. Decision: identify central positions 6/7 and their actual labels; preserve any separately chosen median rule. Result: no fabricated response category or assumed equal half-step.
O3 — The average rises after the codes change from consecutive to unequal gaps. Decision: retain both mappings and show that the same twelve category answers produced them. Result: a scoring change, not observed improvement or greater satisfaction.
Save the item, states and allowed interpretation
The worksheet retains the exact item/version, ordered labels, counts, other states, chosen base, central positions, any numeric mapping and its justification. The supplied standard-library checker reproduces both means and the category ledger. It cannot validate an instrument, infer unknown answers or establish independent participants.
The relevant CDC definitions were read on 1 November 2026. The mapping comparison, numbers and reporting decisions are our constructed exercise. No feedback was collected and no questionnaire or fixed comparative study was changed. Use the survey-design guide for neutral wording and routing, and this guide when the unresolved job is a defensible summary of ordered answers.
Sources & product references
Product details reflect the publication date. External features and interfaces may change.