The short answer
Read the actual values, units and axis mapping before interpreting the picture. Filled magnitude bars need a zero baseline; points and lines can use a clearly explained narrower range when appropriate. Compare panels on compatible scales and keep logarithmic spacing explicit. An impressive visual gap cannot create a larger measured change or recover a missing value.
What you’ll take away
- Check the baseline and data values separately.
- Use compatible ranges for a magnitude comparison across panels.
- Never move a measured zero to one merely to fit a logarithmic axis.
State what the axis and mark actually encode
Start with one reader question and a declared unit: count, rate, stock or interval event. Keep the same observation definition across the compared values. The separate chart-selection guide chooses the visual relationship; this review checks the numeric mapping after that choice. A correct chart type can still exaggerate its data through an unsuitable scale.
Read axis start/end, tick intervals, unit labels, missing periods and any transformation. Look for different scales across panels or a second vertical axis that makes unrelated series seem aligned. ONS recommends simple linear scales where possible and warns that dual-axis charts can be difficult to interpret; separate aligned charts can make the assumptions clearer.
Trace the complete constructed baseline example
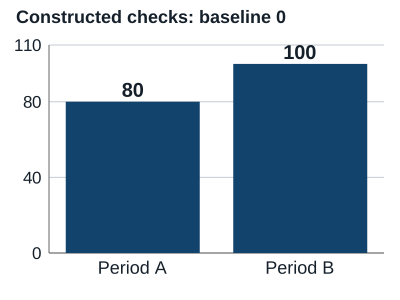
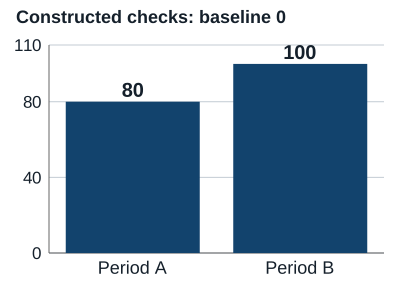
The owned fixture contains 80 completed checks in period A and 100 in period B, under the same declared count definition. Their value ratio is 100/80 = 1.25 and the difference is 20, or 25% of A. These are invented teaching counts, not measured people, content quality or business growth.
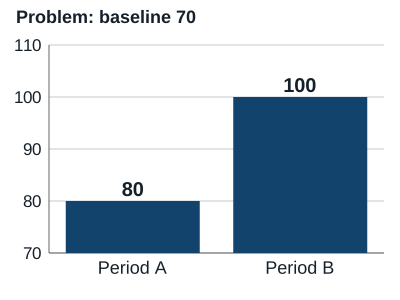
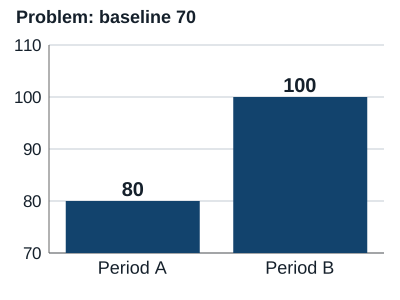
With a zero baseline the bar lengths preserve that ratio. Starting the filled bars at 70 instead produces visible lengths 10 and 30: a three-to-one length ratio from values only 1.25 times apart. The two original figures expose this distortion; the cropped version is explicitly a problem example, not a recommended improvement chart.
| Period | Value: checks | Length from 0 | Length from 70 |
|---|---|---|---|
| A | 80 | 80 | 10 |
| B | 100 | 100 | 30 |
Distinguish point variation from filled magnitude
A line joining observations 93, 95 and 97 can use a clearly labeled 90–100 range to show variation, since its points are not bars measured from the baseline. Retain the values and explain the range. This does not mean every narrow range is helpful, or that a four-unit change is automatically important to a reader.
When two panels invite a magnitude comparison, use compatible axes or make the different question unmistakable. A panel topping out at 100 beside one topping out at 1,000 can make 90 and 900 look equal. Do not crop away the numeric axes or rely on a caption saying only “large improvement.”
Resolve three constructed scale decisions
S1 — Constructed counts 80 and 100: zero-baseline lengths have ratio 1.25; a baseline at 70 makes the visible lengths 10 and 30. Decision: keep the zero baseline for magnitude bars and report the actual 20-count difference. Outcome: no threefold measured improvement inferred from the cropped image.
S2 — Constructed point observations 93, 95, 97: the question is their small variation, not area from zero. Decision: retain an explicit suitable range, all point values and the limited question. Outcome: a four-unit endpoint difference, not proof that a creator strategy caused a meaningful effect.
S3 — Constructed values 10, 100, 1,000 plus one actual zero: equal log steps represent multiplication, and log zero is undefined. Decision: choose an appropriate other presentation or a clearly explained separate zero treatment. Outcome: never silently replace zero with one or treat unknown as a tiny positive value.
Review the scale in the actual delivered figure
Check the export at the intended reading size: axis labels, endpoints, data labels, source/unit and problem-example status must survive. A screenshot crop can remove the very baseline that made a comparison interpretable. Keep a complete text/data equivalent so the argument does not depend on estimating a bar length.
The original figures use a standard chart renderer from an existing dependency installation, with constructed data and a supplied rendering recipe. They illustrate numeric mapping only. A successful SVG render does not validate a source, certify all accessibility, measure perception or show that readers prefer one story.
Keep the mapping and bounded interpretation
The worksheet records question, source/unit, raw values, mark type, baseline/range, transformation, comparable panels, missing/zero treatment and the exact exported file. Save both the rejected mapping and the selected explanation when they help another person reproduce the decision.
ONS axis guidance and relevant primary accessibility guidance were read on 1 November 2026. All S-cases and figures are constructed. No real analytics export, private account, human perception study or content effect was measured.
Sources & product references
Product details reflect the publication date. External features and interfaces may change.