
The short answer
In our four constructed four-page documents, vector PDFs were 4,463–31,095 bytes; all 24 raster variants were larger. A lower-resolution PNG was not consistently smaller. This measures our local PDF pipeline, not LinkedIn processing, human readability or engagement. Download all conditions and inspect your own export before adopting a setting.
What you’ll take away
- All four designs and all seven export conditions are retained, including surprising results.
- Resolution, compression, text structure and displayed reading size are separate decisions.
- The experiment is reproducible file research, not a real-reader study or a platform recommendation.
The question and what we controlled
A carousel author often sees export choices such as PDF, image quality and output resolution without knowing which property is changing. We asked a narrow question: for documents made of original text and shapes, how do vector content, raster resolution and JPEG quality affect bytes and decoded pixels? We recorded the protocol before running the exports on October 31, 2026.
We authored four original four-page documents: a sparse explanatory brief, a dense numerical table, a process diagram and a deliberately detailed synthetic pattern. Pages are square, 540 PDF points per side. Text, values and shapes are constructed test material. There are no real customers, account records, borrowed artwork or photographs. The synthetic pattern is not a substitute for a photographic test set.
This is an automated first-hand export experiment by Wrapped.li. It is not an independent human review, a test of every design editor, or an observation of LinkedIn upload processing. The examples were created for this question rather than selected from successful posts.
Seven conditions for every document
Each document was exported as its vector original, PNG at 1080, 720 and 540 pixels per side, JPEG at 1080 pixels with quality 90 and 70, and JPEG at 720 pixels with quality 70. Raster pages start from the same 1080-pixel render of their vector original. Each image is embedded into a PDF with the same 540-point page geometry. JPEG uses 4:4:4 chroma sampling.
The pipeline used pdf-lib 1.17.1, sharp 0.35.5 and Poppler pdftoppm 26.05.0, with Node 24.21.0. Metadata dates are fixed. The public generator contains the full source definitions and commands, while the JSON records library versions, settings, page results and output SHA-256 values. The complete bundle includes all 28 PDFs, not just a preferred example.
Resolution comparisons within PNG hold its encoding method constant. The JPEG-quality comparison holds 1080-pixel resolution constant. Comparing vector against a raster PDF changes representation and rendering as well as encoding; it does not isolate a single compression effect. A second full run reproduced all 28 PDF hashes and per-page metrics exactly in this environment.
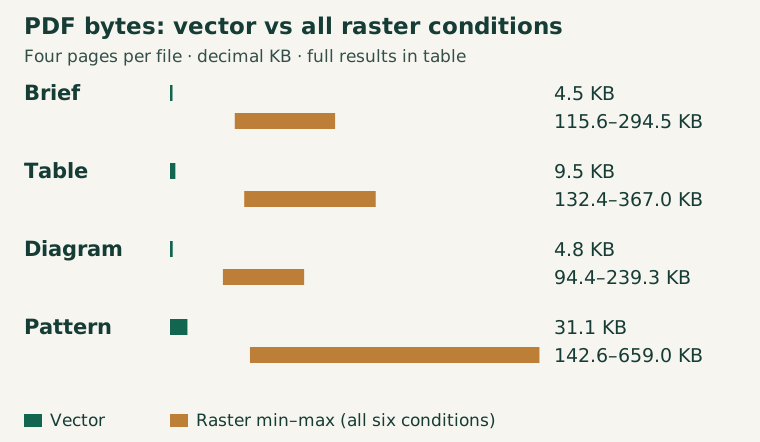
File size: a smaller raster was not always a smaller file
The table gives exact bytes for the complete seven-condition set. All four vector originals were smaller than every raster version of the corresponding document. For the dense table, the vector file was 9,540 bytes, the 1080 PNG PDF was 244,027 and the quality-70 1080 JPEG PDF was 240,699. These are whole four-page PDF files, including their document overhead.
Every 720-pixel PNG was larger than its 1080-pixel counterpart in this pipeline. Resampling introduces intermediate edge colors and changes what compresses efficiently. This result warns against assuming that reducing dimensions must reduce a text-and-shape PDF. It does not establish that higher resolution always saves space. JPEG quality 70 reduced bytes relative to quality 90 at 1080 pixels for each tested document.
| Condition | Brief | Table | Diagram | Pattern |
|---|---|---|---|---|
| Vector | 4,463 | 9,540 | 4,831 | 31,095 |
| PNG 1080 | 153,609 | 244,027 | 134,025 | 142,620 |
| PNG 720 | 235,679 | 292,399 | 176,779 | 343,805 |
| PNG 540 | 160,038 | 194,840 | 120,384 | 259,327 |
| JPEG 90 / 1080 | 294,503 | 366,976 | 239,270 | 658,972 |
| JPEG 70 / 1080 | 206,155 | 240,699 | 169,218 | 455,090 |
| JPEG 70 / 720 | 115,552 | 132,390 | 94,367 | 327,710 |
Pixel difference measures a pipeline, not a reader
We rendered each PDF page at 360 × 360 pixels with Poppler and computed RGB root-mean-square error against the same page of the vector original. Every channel and pixel contributes; the four page errors are averaged for the document. The JSON and CSV retain the individual page results. The vector baseline has zero error by definition, which is not a fairness-adjusted quality score.
At 1080-source PNG, mean error ranged from about 18.96 for the diagram to 38.19 for the detailed pattern on the 0–255 channel scale. The corresponding 540-source PNG values ranged from 21.22 to 44.40. Antialiasing, image interpolation and pixel alignment affect these differences, including for lossless PNG. There is no measured cutoff at which a person can or cannot read a page.
We inspected representative decoded pages to check layout and export mistakes, and publish sample views alongside the files. We did not ask readers to identify symbols or complete tasks, test assistive technology, run OCR accuracy tests or establish a statistically representative design sample. A small numerical difference between two variants cannot be promoted into a claim of visibly equal quality.
A visually similar PDF can retain different structure
We also counted text-drawing blocks and embedded page-image objects in decoded PDF content streams. The vector files retain text-drawing blocks: 24 for the brief, 136 for the table, 28 for the diagram and 16 for the pattern across four pages. Each raster file has zero such blocks and one embedded page image per page. This records document structure, not a successful text-extraction or screen-reader test.
W3C recommends actual text rather than image-only text in PDFs and discusses checking text accuracy and order. Our untagged experimental vector PDFs are not accessibility-certified merely because they retain drawing operations. Neither file size nor pixel fidelity establishes reading order, meaningful tags, correct language or a useful alternative description.
Use the result to choose the next inspection
For an original text-and-shape document, begin by inspecting an export that preserves text and vector content. Check its actual bytes, text behavior and small-view layout before deciding to rasterize or compress it. When images are required, compare a controlled change in resolution or encoding on the actual artwork. Keep an editable source so you can repair the content instead of repeatedly compressing an already degraded copy.
To reproduce, use the published generator with the recorded package versions and an available pdftoppm executable, then compare hashes and page metrics with results.json. Different renderers, library builds, fonts or defaults can produce different bytes and pixels. The method uses Base-14 Helvetica, not a full multilingual font corpus. There is no inference about photographs, all design apps or all devices.
A real destination can reprocess the file. This experiment did not upload any document to LinkedIn, measure its recompression, observe audience behavior or compare revenue. Its practical result is a transparent set of files and a bounded inspection method. A separate real-reader task study is still needed to learn which published artifact helps people finish their work.
Sources & product references
Product details reflect the publication date. External features and interfaces may change.


